
Damian Spangrud – April
Tell us about yourself.
I’m a carto geek and have been making varying degrees of visual junk for almost 3 decades. I’m interested in showing data in a way that makes people curious to learn more. I’ve been at Esri for 23 years and I’m the Director of Solutions (which means 2 things: 1. my team builds industry specific maps and apps to make it easier to use and 2. problems tend to find me). Visualizing space and time in static printed maps has limited how we tell stories about data for hundreds of years, and the move to fluid digital data means some long-standing cartographic rules may need to be bent…
Tell us the story behind your map (what inspired you to make it, what did you learn while making it, or any other aspects of the map or its creation you would like people to know).
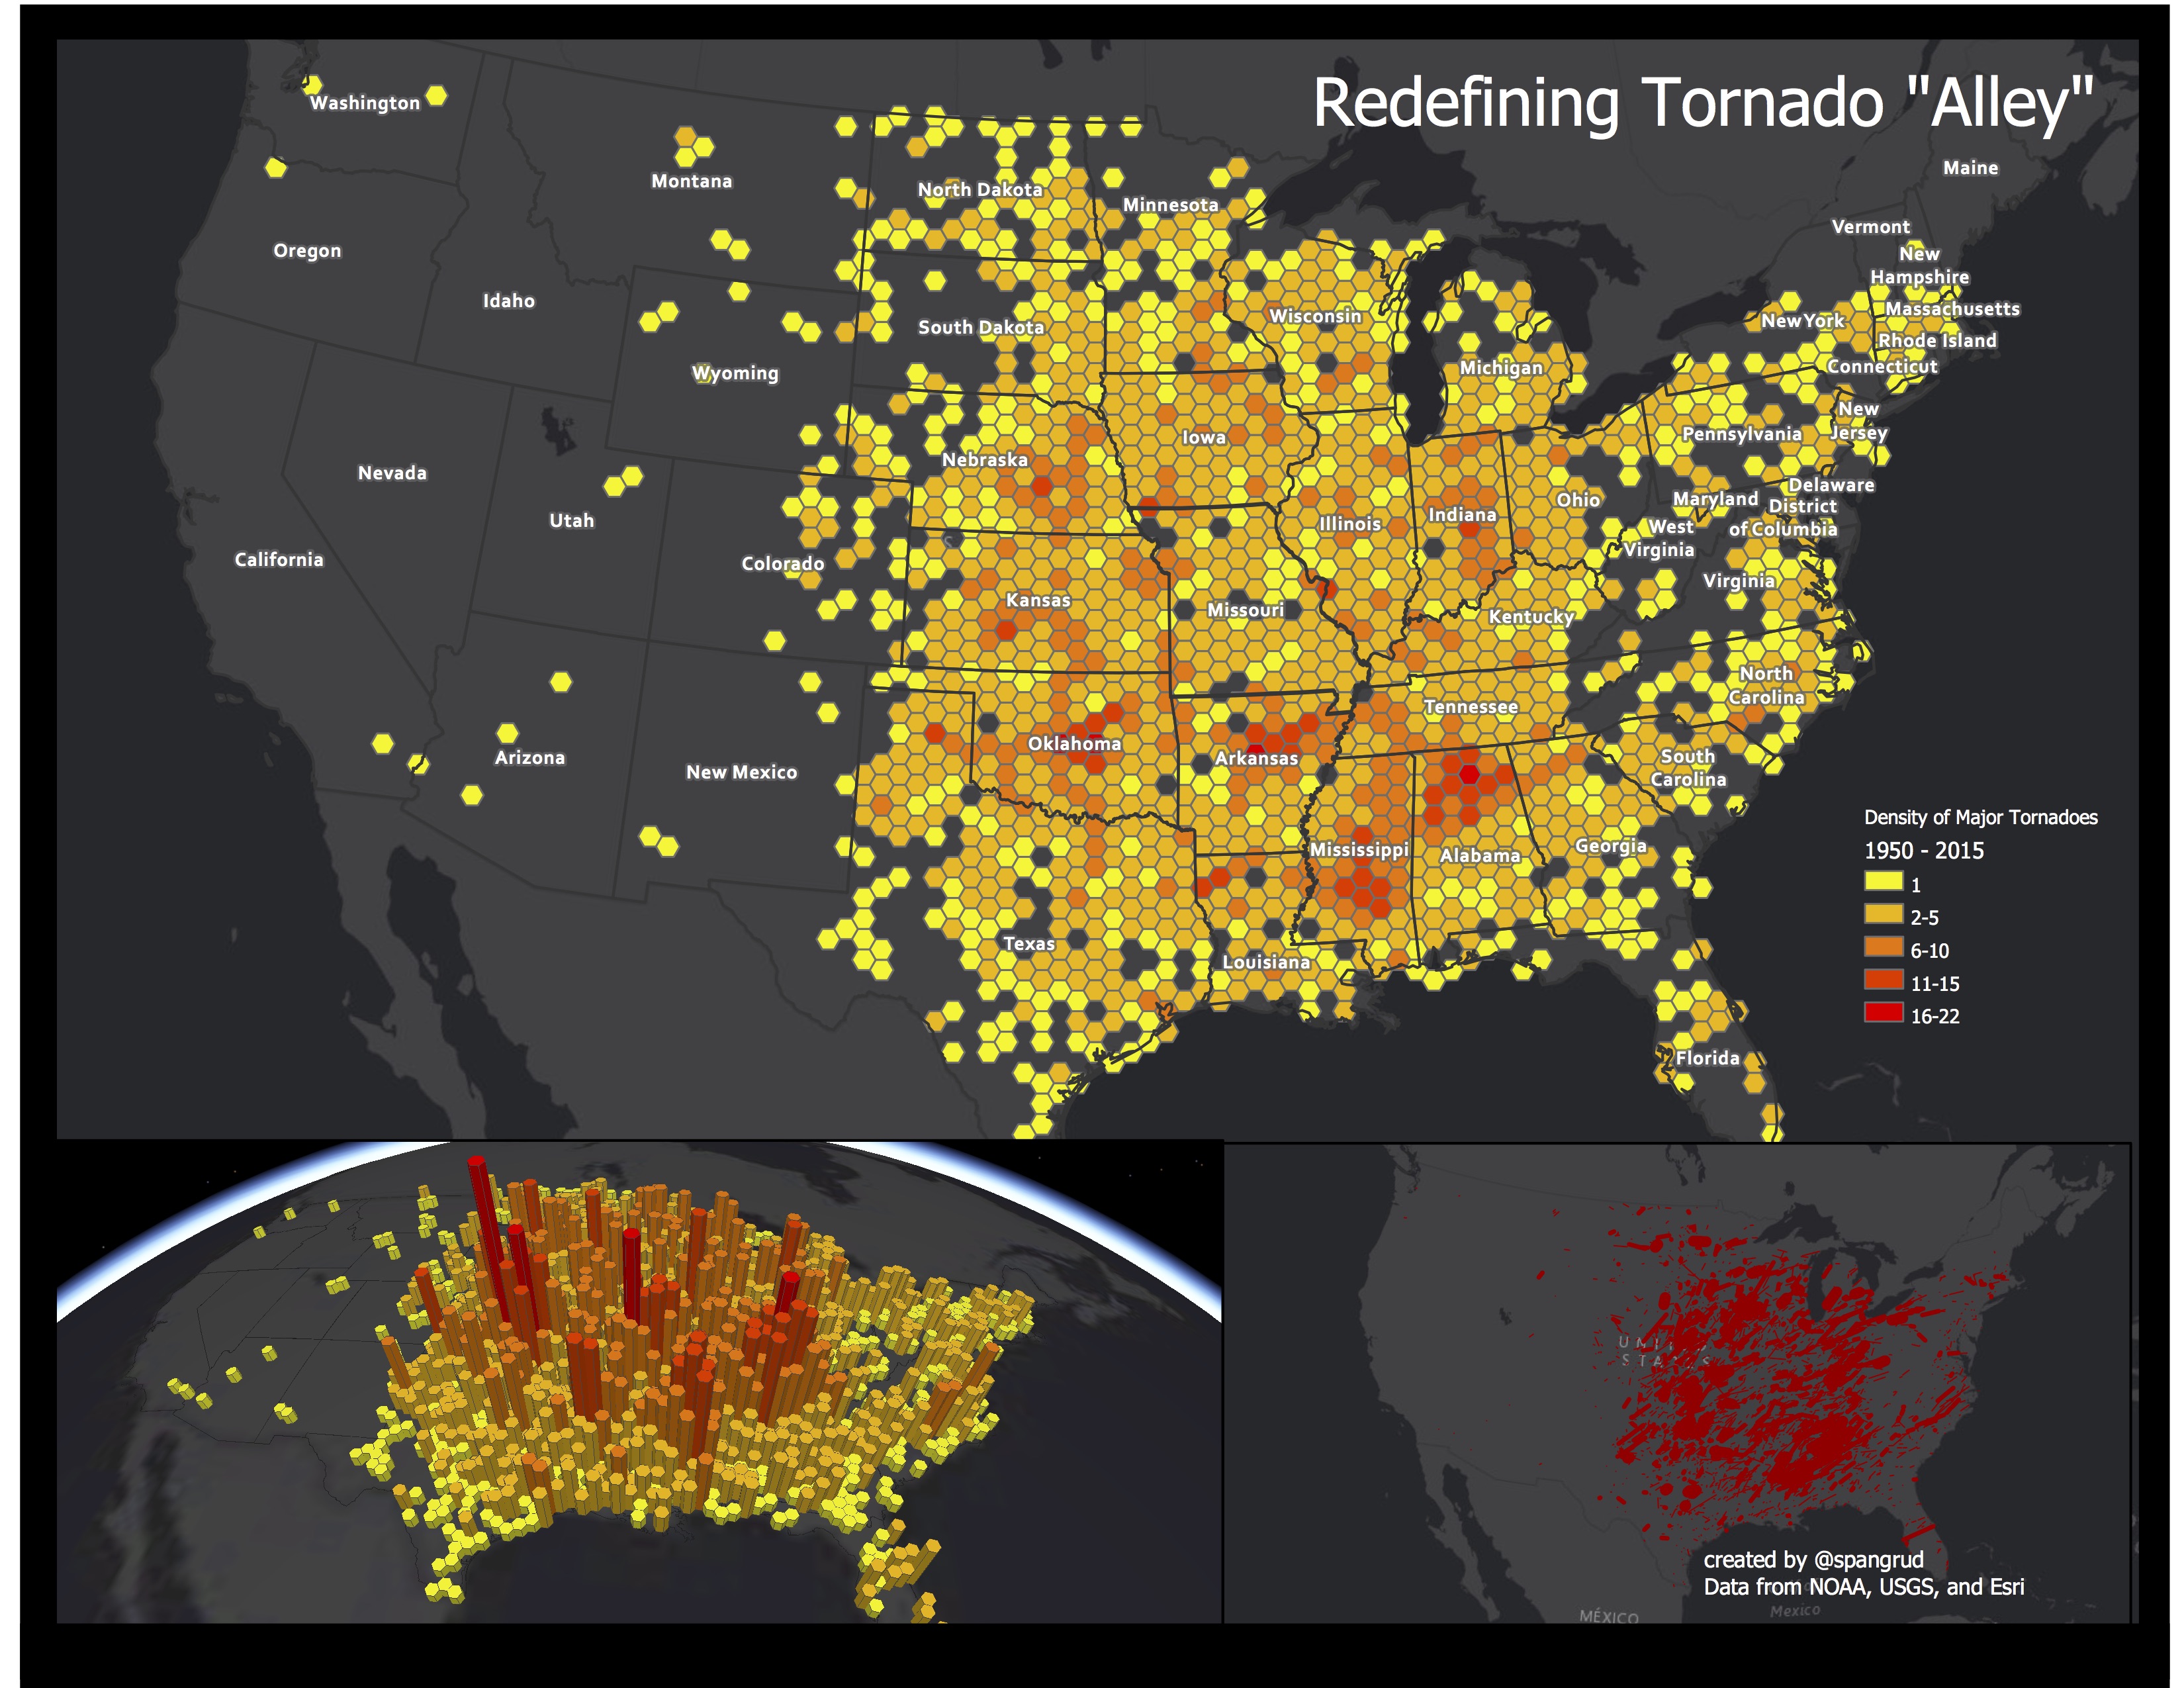
I grew up in the Midwest and tornadoes were a fact of life. But while I knew I lived in Tornado Alley, I never had a good sense of what was the extent of that alley. And the maps that tried to define it seemed based on ideas and thoughts and not data. So I used data aggregation along with 3D to visualize the historical frequency of where tornados occurred. The raw data is a spaghetti mess of lines, but when aggregated into hexagons it becomes clear there is no narrow ‘Alley’, rather a large neighborhood. Looking at the data more you could see a pattern on when and where tornadoes were more likely. And using interactive time sliders you can also explore the general direction of tornado travel (which varies widely by region).
Tell us about the tools, data, etc., you used to make the map.
I used the historical tornado data (1950-2015) from NOAA. I used ArcGIS to aggregate the data into hexagons and do the 2D and 3D visualizations. The aggregations were based on count of major tornadoes (above a F3 on the Fujita-Pearson scale) inside the hexagons. I used the same color scale in 2D and 3D to allow for easier comparisons. But I felt both 2D and 3D added to the understanding of the pattern.
Comments
One response to “Maps and Mappers of the 2017 GeoHipster Calendar – Damian Spangrud”
[…] http://www.geohipster.com/2017/04/18/maps-mappers-2017-geohipster-calendar-damian-spangrud/ […]