Sending off the year 2015, we present to our readers the mapmakers who contributed their work to the 2015 GeoHipster calendar.
***
Bill Morris
Q: Tell us about yourself.
A: I’m a cartographer and data plumber at Faraday Inc, where I come up with ways of analyzing and visualizing several metric tons of demographic/property information. Big fan of open source mapping. Big fan.
Q: Tell us the story behind your map (what inspired you to make it, what did you learn while making it, or any other aspects of the map or its creation you would like people to know).
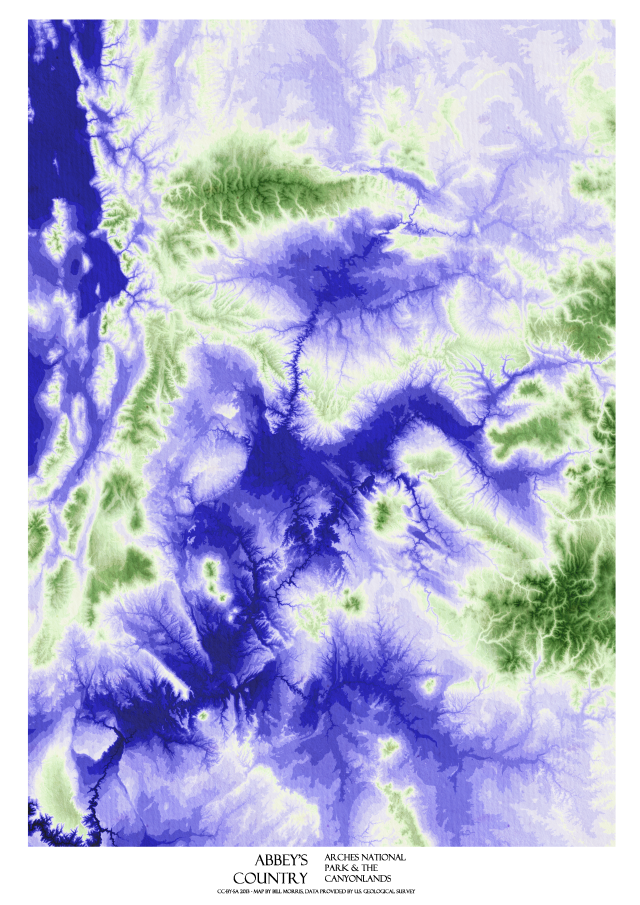
A: I’m a longtime devotee of Ed Abbey’s work, and I love how he describes the landscape in three dimensions in “Desert Solitaire”, climbing and delving. I wanted to use a single data source to show the amazing terrain of the Four Corners region, with deliberate divergence to pull apart the canyons and peaks. In particular I wanted the fern-shaped Uinta ridge and the island around Tukuhnikivats to stand out from the depths of the river channels. The paper texture was an afterthought, because the relief looked a little too sterile on its own.
Q: Tell us about the tools, data, etc., you used to make the map.
A: I used Mapbox’s first-generation platform Tilemill to make this map, selecting a color scheme with the help of Gregor Aisch’s chroma.js toolkit. The DEM came from the US Geological Survey’s NED dataset, and I did the print layout in Inkscape. I also put together a proto-scrolly-mapstory with some of my favorite Abbey fragments, using tiles created from the same project: http://wboykinm.github.io/arches/.

