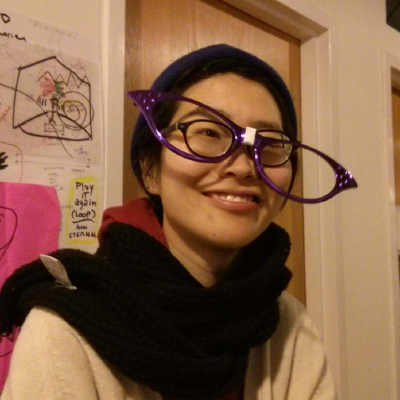
Hanbyul Jo is a New York-based software engineer. She works at the open source mapping company Mapzen, where she develops tools to make web mapping more accessible.
Hanbyul was interviewed for GeoHipster by Mike Dolbow.
Q: How did you get into mapping/GIS?
A: It was a lot of connecting dots. Mapzen, where I work currently, is where I got into mapping. Before working at Mapzen, I was at the intersection of visual arts and technology. I did some random things including installations and performance. I was not sure what I was doing at that time, so went to a 2 year master program covering technology and arts hoping to figure out what I can/want to do. (Now that I reflect, I was more lost in the program…it was fun wandering.) In the 2nd year of the program, I got into making physical objects in a parametric way with digital fabrication tools. For my thesis project, I wanted to fabricate the map of Brooklyn out of paper. The problem was that I did not have any clue about how to get the shape of Brooklyn at that time. Any concept of geo data at that time was foreign to me. Repeating some unfruitful tries, I started getting into this whole map thing. Looking back, my thesis project was a hot mess… However I didn’t fail! As I was leaving school, I had to start thinking about what the next step would be. As I narrowed down my interests, I thought that maps are a combination of many things I like, such as programming, cities, visuality, data. I looked up map companies that I could find in New York City, and here I am now.
Q:Tell us about your work with Mapzen. What’s your latest exciting project?
A: It is Mapzen.. we don’t put that much emphasis on zen 😉 (This was Hanbyul’s response to me originally capitalizing the “Z” –Ed.) I work as a front-end developer at Mapzen. It is my main job to develop tools that can make web mapping accessible for non-tech/geo-data savvy people. Since Mapzen is not a big company, I’m also responsible for some general front end work such helping other teams’ demos, UI work etc.
A new project that I am excited about is a tool for people to generate basemaps easily. Our cartography team is trying to offer basemaps in a modularized form so that they can be assembled as user needs, e.g.. making labels super dense with a yellow theme. This project just started and is still in a very early stage. If you are a cartographer in need of basemaps that are easily tweakable, we will reach out to you soon!
Q: Your Github account is pretty busy, and you have some cool maps hosted there, like this Seoul building explorer. Can you tell us more about this map and the inspiration behind it?
A: I sometimes think I would never have put anything on GitHub if it were not for my job. All the thoughts such as, ‘What if some people point out this is not the best practice? What if I am doing something totally ridiculous?’ really freaked me out at first. I anyway had to do it on daily basis because my current job requires as many things as possible to be open source, and then I finally got used to it.
Thanks for checking out Seoul Building Explorer. That was one of my full-stack projects that I got to every bit of what it takes to make a web map out of geospatial data. As a person who develops tools for cartographers, I often try to get my hands on the full workflow that cartographers should go through (from geospatial data to web map). When I was looking at how to deal with tiles, I noticed South Korea started making a lot of geospatial data open source. That was the basic foundation of Seoul Building Explorer. The map was iterated several times. The original data had a really wide range of building data such as materials, purposes of the buildings etc. It was so exciting that there is data openly available for me that I put all of them at once at first. Then I realized maps trying to tell everything often fail at telling anything. I started thinking about what I want to see in the map as a person who spent a lot of time in that city, and I also got some feedback from my coworkers with urban planning and design backgrounds. With some inspirations such as built:LA and the NYC PLUTO dataset map, Seoul Building Explorer got shaped as it is now.
Q: As far as I’m concerned, you delivered the coolest talk at JSGeo 2017 (among a pretty amazing slate of presenters), wowing the audience with pictures of 3D printed maps in materials like chocolate and ice! How on earth did you ever come up with that?
A: Did I? 😊
I am always jealous of people who grew up reading maps. Top down view maps were not part of my growing up. All buildings and landmarks were relatively positioned around me: the post office is next to the supermarket, my friend’s house is two units next to mine. Maybe this is because there was no street number system in Korea (where I grew up)? Even after mobile devices became prevalent, I didn’t often have to go somewhere that I was not familiar with, so didn’t really use maps that much.
After moving to NYC, maps became part of my life. I started looking at maps much more often than before as a newcomer of the city. While struggling to read the directions from it, my illiteracy of maps left me room to consider them as visual objects. Just like how letters look like paintings when you don’t know the language.
As I answered before, I first got interested in maps to fabricate with them. Working at Mapzen, I discovered many ways to convert/export maps into easily fabricatable forms (which was my js.geo talk topic. I gave a similar talk at NACIS 2017, you can check it out here). Also some of my great friends and classes at grad school taught me a great deal of craftsmanship and tips when dealing with real life materials. It really helped me to go through the whole fabrication process to know what to expect from real life materials.
Q: Geohipsters are often described as thinking outside the box, doing interesting things with maps, and contributing to open source projects. So, the evidence is stacking up: do you think you’re a geohipster?
A: I have really problem with labeling myself in my life. Hehe… but if I am a geohipster, why would I be in a geohipster box? 🙂
Q: When your chocolate maps become an international sensation, what words of wisdom will you deliver to your adoring fans?
A: Floss your teeth after eating chocolate.


Comments
One response to “Hanbyul Jo to GeoHipster: “Letters look like paintings when you don’t know the language””
[…] http://www.geohipster.com/2017/12/11/hanbyul-jo-geohipster-letters-look-like-paintings-dont-know-languag… […]