
Tell Us About Yourself:
I was born and raised in Mexico City. I have a master’s in Spatial Planning [meaning absolute space], and I am a map enthusiast and a criminal analysis enthusiast, what better way to represent criminal behavior than using maps! I worked as a crime analyst for years in Mexico and I am kind of changing careers now but always trying to bring something to the table related to map representations.
I have always loved maps and I think using them to represent certain phenomena will put a different view on complex topics such as crime and delinquency, a needed view. Aside from working, making maps, being a mom, and navigating through life, I am currently exploring the fascinating world of board games. I find it intriguing how the beautiful art in these games is related to the cartography of strange worlds and other interesting topics.
If you’re interested in connecting with me, you can find me on LinkedIn at (https://www.linkedin.com/in/laura-bautista-montejano/)
Tell us the story behind your map :
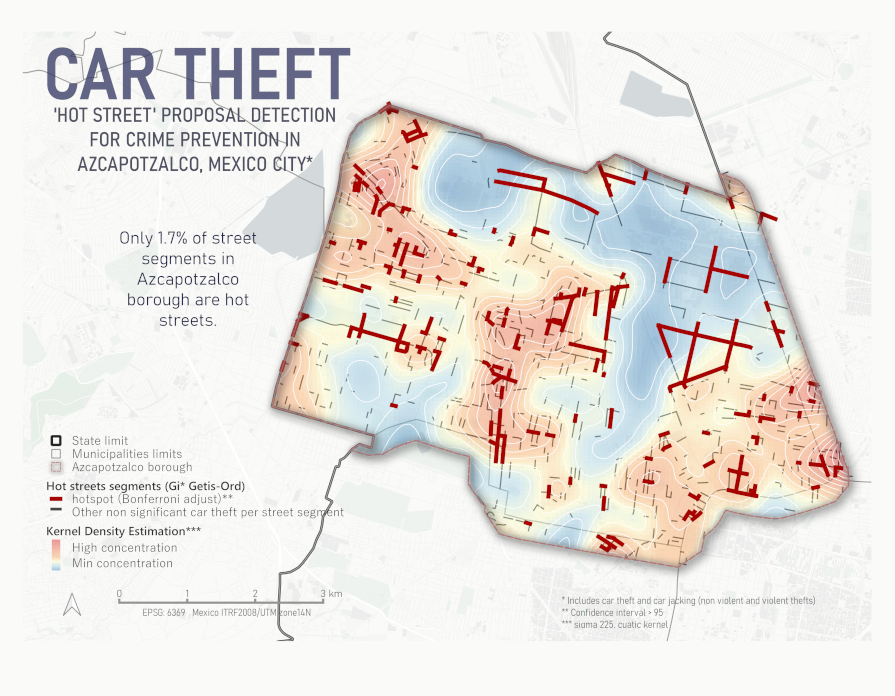
My map is part of my thesis research, I was focused on the best representation of hotspots, and I chose ‘hot streets’ for two reasons: first, they are a novelty in the environmental crime approach. Second, unlike the classical hotspot representation using Kernel Density Estimations (KDE) that depend on criteria such as radius and shape of the kernel [there are several criteria to choose and pretty much the final representation is defined by the analyst], streets are easier to read by police workforce which are ultimately the ones doing patrol work.
The map compares the KDE (in the back) with the hot streets (at the front). Only those with a keen eye for detail will notice that there are areas with the KDE in the minimal concentration but have significant hot streets, that is because concentration is measured differently and that is why ultimately, I rather use streets instead of points.
There was a lot of coding, and without the help of my thesis director, Camilo Caudillo Ph.D. (https://www.researchgate.net/profile/Caudillo-Alberto), I wouldn’t be able to finish.
Tell us about the Tools, data, etc., that you used to make the map:
I know looks simple but I only used free code software so it was challenging: I extracted data with coordinates of car theft and carjacking from the databases of the Attorney‘s Office of Mexico City for only 2020 to 2021; then I got and cleaned the line geometries to obtain street segments; after, I put everything in RStudio to perform several statistical routines [count point geometries to the closest line and then calculate local spatial autocorrelation Gi* de Getis-Ord for those lines to finally extract the significant ones by using Bonferroni adjust]. Finally, combine layers in QGIS.
Leave a Reply