
Tell Us About Yourself
I am currently writing my master thesis for the MSc. Cartography program (https://cartographymaster.eu/). I have always liked maps. The more details, the more I like them. I get fascinated how artistic they can be. My background is in Geography but was a bit frustrated when a map was seen just as an output simple image, therefore, I decided to do the master in cartography.
Tell us the story behind your map (what inspired you to make it, what did you learn while making it, or any other aspects of the map or its creation you would like people to know)
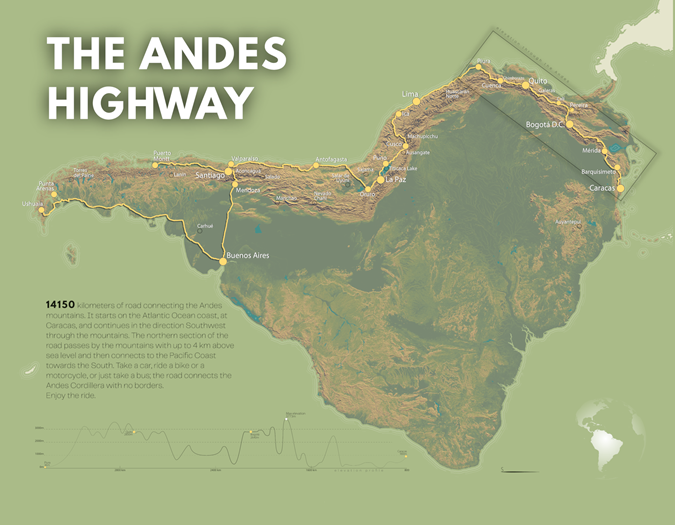
The map idea is based on the connectivity that exists along the Andes mountains in South America. Particularly because with the elevation and difficulties of the terrain, it remains connecting cities along the western coast. It is a fascinating route worth to travel by any kind of terrestrial transport. It allows the traveler to visit cities and places with an elevation difference of up to 4 km.
The aim of the map is to motivate people to travel along South America and the Andes mountains. Borders are avoided as the region not only shares mountains but, language (Spanish) and culture. Wouldn’t it be ideal to travel without borders? Remarks along the road are intended to be used by the reader if traveling through it, starting in the north in Caracas, crossing the mountains for up to 3770 meters above sea level, and ending the journey in Tierra del Fuego in the south.
The map size was originally A1 (594 x 841 mm) and vertically oriented, therefore, some details I now notice that were not correctly resized. It was made as part of the course Project Map Creation at TU Wien during the summer semester of 2022. Because of the Geohipster specifications I thought on just turning it horizontally because, in the end, its just a matter of perspective. It is funny that people turn the map vertically sometimes to “see it properly” but then they realize the map is intended to be read the way it is.
Tell is about the Tools, data, etc., that you used to make the map
I used a 10-meter resolution DEM (digital elevation model) for generating the terrain model. Combining different techniques for mountain representation it was possible to get the color palette that resembles reality mixed with digital coloring. It was intended not to add more data on top of the terrain due to its detail level. I liked the final palette because it is possible to differentiate between dramatic changes in elevation that happen because of the Andes mountains, where the max elevation is above 6000 meters, and rivers flow details that are almost at sea level, for instance, explore the Amazon River to the east.
The map was made using ArcGIS Pro and Adobe Illustrator.
Leave a Reply